
See 24,000 years of climate history at a glance
A new analysis of hundreds of sediment cores shows the retreat of the glaciers in microscopic detail.
- Science
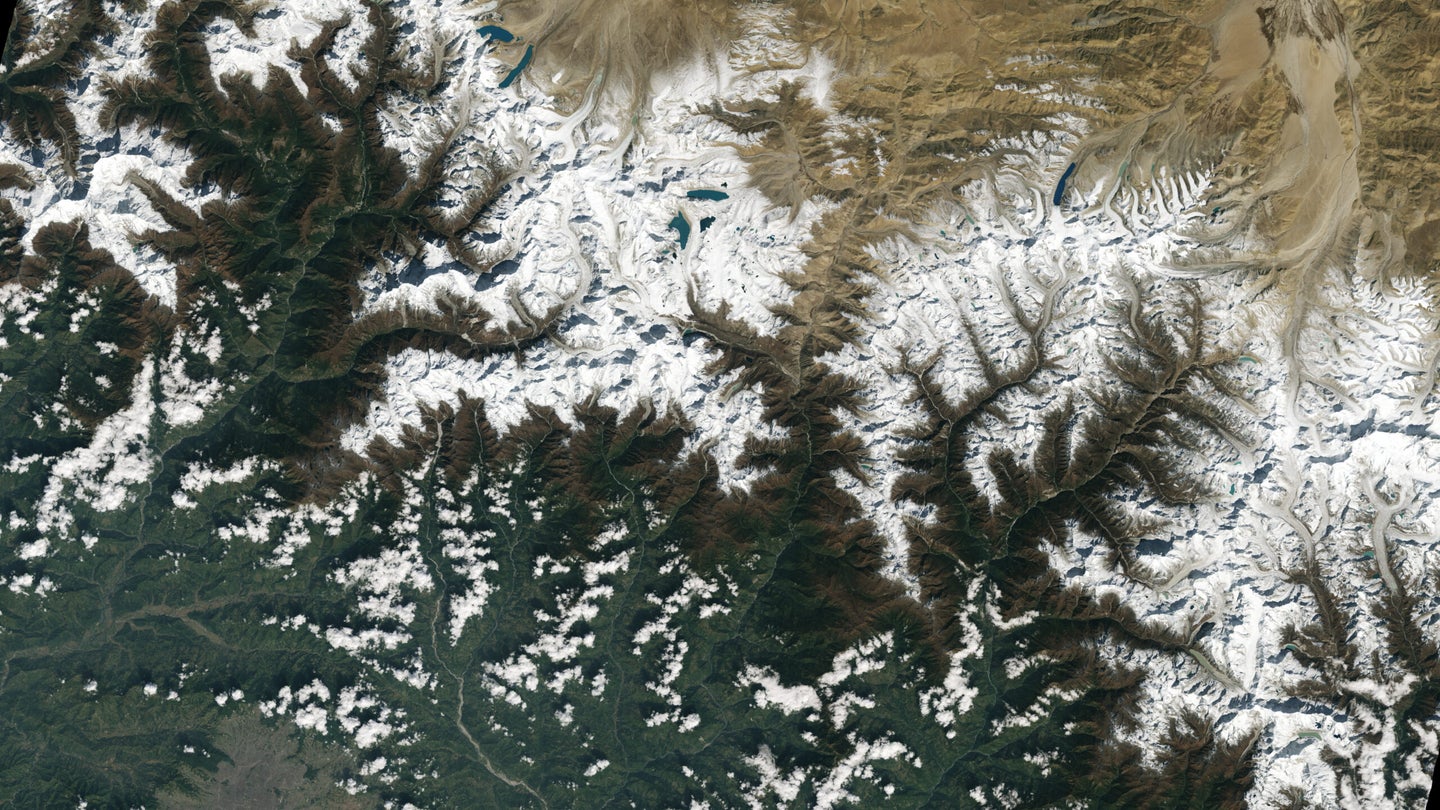 The city of Kathmandu, Nepal, seen at the bottom left of this Landsat 9 image, lies in a valley south of the Himalayan Mountains between Nepal and China. Glaciers, and the lakes formed by glacial meltwater, are visible in the top middle of this image. Previous studies with Landsat have documented shrinkage of Himalayan glaciers, as well as changing lake levels the adjacent Tibetan plateau. NASA SHARE
 It shouldn’t come as a surprise that Earth hasn’t been this hot in a very long time, and, unfortunately, is on track to get hotter. Now, a map of global climate going back 24,000 years recently published in Nature allows us to see those changes over this time period, mapped out across the planet.
var siteRootDomainParts = window.location.host.split("."); var siteRootDomain = window.location.host; if ( siteRootDomainParts.length >= 2 ) { siteRootDomain = siteRootDomainParts[siteRootDomainParts.length - 2] + "." + siteRootDomainParts[siteRootDomainParts.length - 1]; } cnxps.cmd.push(function () { cnxps({ playerId: "d0aa10a3-c0c5-48e8-865e-f5d73ae74404", customParam1: window.empire.apps.ads.targeting.pageId + "", customParam2: window.empire.apps.ads.targeting.section + "", customParam3: window.empire.apps.ads.targeting.keywords + "", settings: { advertising: { macros: { cust_params: "site=" + siteRootDomain + "&targeting_article=" + window.empire.apps.ads.targeting.externalId + "&targeting_section=" + window.empire.apps.ads.targeting.section + "&targeting_keyword=" + window.empire.apps.ads.targeting.keywords + "&article=" + window.empire.apps.ads.targeting.pageId, article: window.empire.apps.ads.targeting.pageId, category: window.empire.apps.ads.targeting.section, keywords: window.empire.apps.ads.targeting.keywords, } } } }).render("404a5343b1434e25bf26b4e6356298bc"); });“This is the first time that you can really go through and get a very personal view of climate evolution at a spot that’s meaningful to you,” says Matthew Osman, a climatologist at the University of Arizona, and the study’s lead author. “I hope what this does is help ingrain a sense of just how severe climate change is today.”
The map is built by comparing sediment cores, which contain a record of temperatures over thousands of years, with historical climate models. Think of it like trying to reconstruct a game of pool, if all you can see are which balls landed in which pockets, and in what order. Each core only shows how the weather changed at a certain location. But researchers can use them to tweak a global model—essentially a time-lapse of the planet’s climate—until it shows a picture that matches the real-world temperature records.
 Courtesy Matthew Osman
 “[The finding] represents a fundamental reassessment of our understanding of climate change over the past 20,000 years,” writes Zeke Hausfather, a climate scientist with the Breakthrough Institute, on Twitter. “It now seems much clearer [that] current warming is unprecedented since at least before the last ice age.”
This new picture of how the planet has changed also gives climatologists a better view of how regional climate systems interact. “Everything is intimately coupled,” says Osman. “If you change the winds over, for example, China, that’s gonna have rippling effects on precipitation over North America. And so what a model does is it allows us to start to pick apart that coupling in a way that makes physical sense.”
The research also mirrors results from a paper published earlier this year that solved a longstanding problem in climate modeling. Although carbon levels rose consistently after the glaciers retreated, sediment cores appeared to show a cooling planet, a fact that climate skeptics latched onto. The previous research found that the apparent cooling was actually an illusion caused by too many sediment cores from the Northern Hemisphere and not enough from other pockets of the world, leading to an inaccurate picture. The work also found that if anything, the planet was much colder during the glaciation than previously thought.
[Related: Not convinced that humans are causing climate change? Here are the facts.]
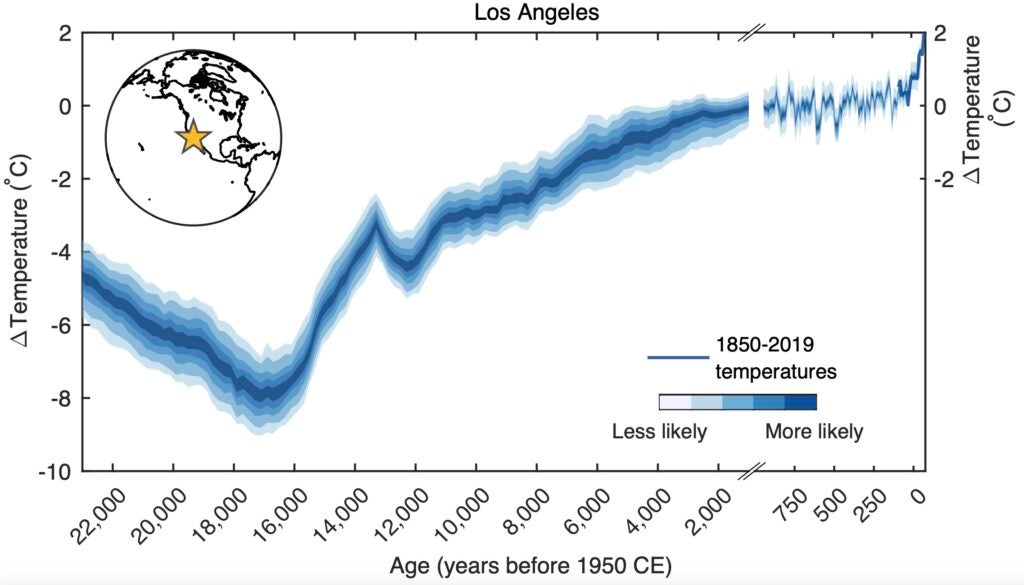
The new map is built with an entirely different technique but finds the same story—when glaciers covered the Northern Hemisphere, the climate was 10 degrees Fahrenheit colder than it is now. It’s been warming ever since, with two rapid bursts about 18,000 years ago and 12,000 years ago.
Warming of 2 to 3 degrees would mean “essentially a large fraction of these interglacial changes occurring in a really, really short amount of time,” says Osman. “And that should be something that I think concerns everybody,” from individuals to entire countries.
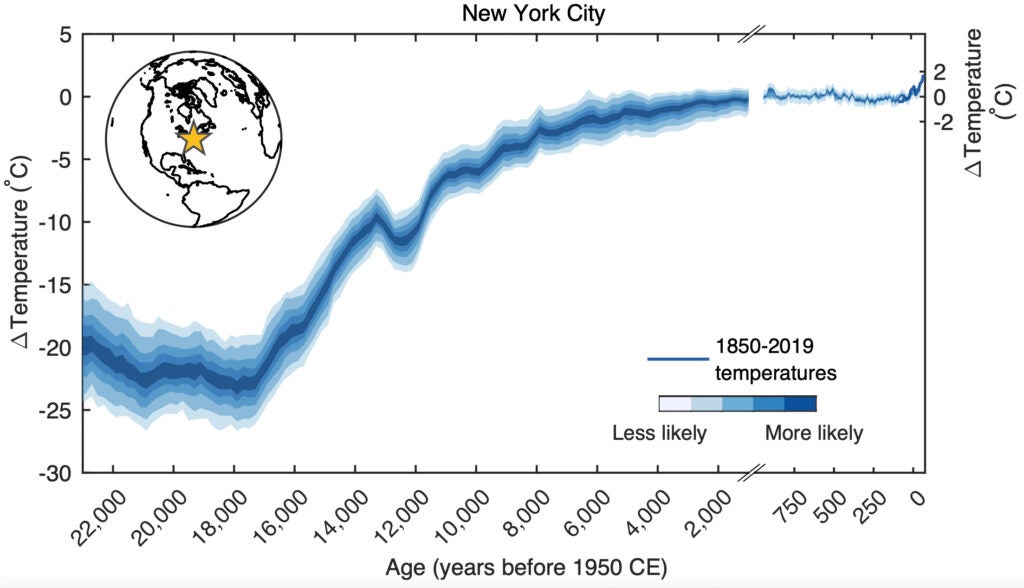
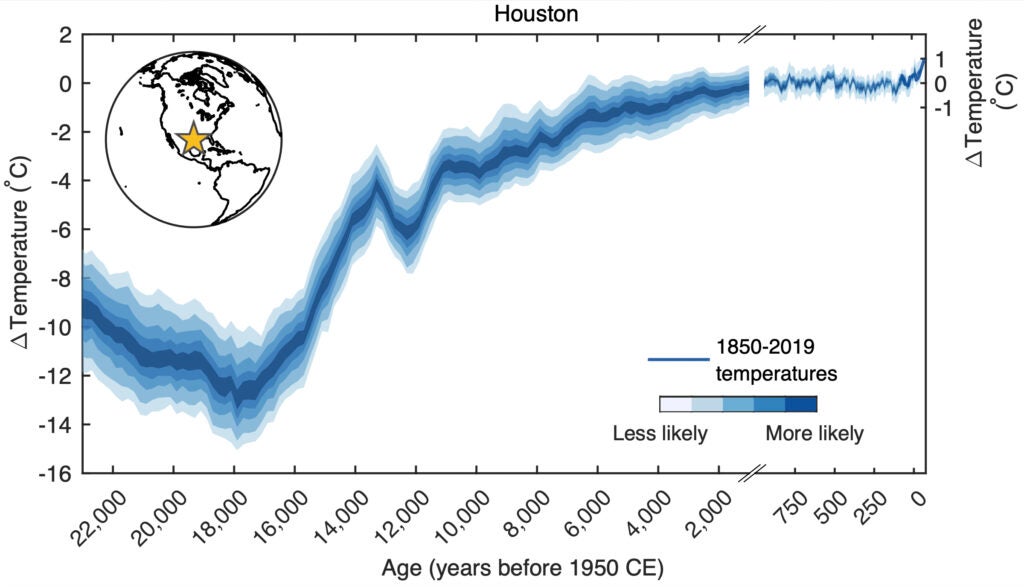
Policies outlined in the Paris Climate Accord would limit warming to 2.7 degrees above pre-industrial levels, although most countries haven’t followed through on those commitments. According to the new research, that would be comparable to the warming that took place between roughly 12,000 and 200 years ago. The planetary change that accompanied that warming is mind-boggling: 12,000 years ago, most of North America was 36 degrees colder than it is today, largely because of the retreating ice sheets.
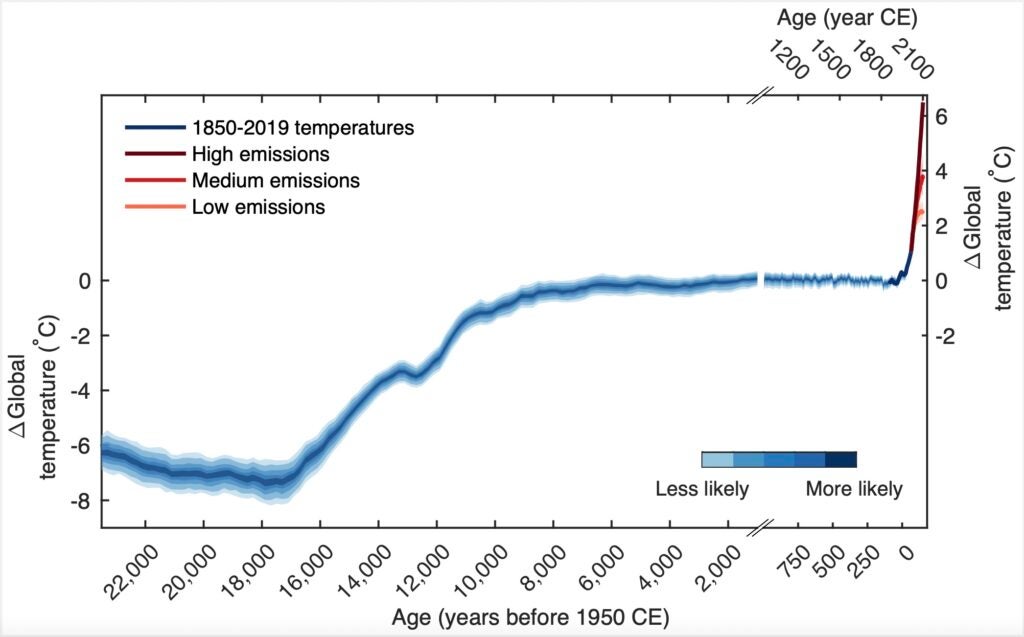 The planet warmed more than 2 degrees between 12,000 years ago and about 1900, and carbon emissions are on track to warm it the same amount in a matter of decades. Courtesy Matthew Osman
 “These are huge, huge, natural changes that are occurring,” Osman says of this period, “where we’re fundamentally shifting the state of the climate system from an ice age into the world that each of us knows today.” We don’t want to find out what would accompany another 2.7 degrees.
 Philip Kiefer
 covers ecology, the climate, public health, and more from New Orleans. His work has also appeared in Outside, National Geographic, and Sierra.
climate change climate models ice age paleoclimatology paris climate agreement MORE TO READ-
 Earth used to be cooler than we thought, which changes our math on global warming
Introducing Jobbguru: Your Gateway to Career Success
The ultimate job platform is designed to connect job seekers with their dream career opportunities. Whether you're a recent graduate, a seasoned professional, or someone seeking a career change, Jobbguru provides you with the tools and resources to navigate the job market with ease.
Take the next step in your career with Jobbguru:
Don't let the perfect job opportunity pass you by. Join Jobbguru today and unlock a world of career possibilities. Start your journey towards professional success and discover your dream job with Jobbguru.
Originally posted on: https://www.popsci.com/science/24000-years-of-climate-history-gif/